Join us today Join us today Join us today Join us in our missionJoin us today Join us today Join us today Join us today Join us today Join us today Join us today Join us today Join us today Join us today Join us today Join us today
Current snapshot of RCV use in the United States
The video below shows how fast RCV has grown in the U.S. since the year 2000. A full list of jurisdictions using RCV is available here.
Voter turnout and participation
Evidence shows that RCV elections often generate relatively high turnout. For example, when New York City used RCV in its 2021 primaries, that election had its highest turnout in over 30 years.
Other evidence finds that RCV increases turnout in municipal elections and RCV boosts youth voter turnout. However, RCV’s full impact on turnout is still not yet known.
Most places that have adopted RCV have switched from a two-round system to a single RCV election. Primary and runoff elections often draw low turnout; RCV substantially improves turnout by consolidating primary and runoff elections into a single higher-turnout general election.
In general elections, turnout is most strongly driven by competitive campaigns and whether the election takes place in an even-numbered year, according to researchers at the University of Missouri-St.Louis. Other characteristics that are independent of the election method, such as media attention, also make it difficult to control for the impact of RCV when studying turnout.
Voter turnout
- Voters in RCV jurisdictions are 17% more likely to turn out for municipal elections than those in non-RCV jurisdictions, according to a 2024 study. The same study found that voters in RCV jurisdictions are more likely to be contacted by campaigns, an important measure of voter engagement. (See Does ranked choice Voting Increase voter turnout and mobilization? Dowling, Tolbert, Micatka, and Donovan. August 2024.)
- Youth turnout in RCV cities was higher than youth turnout in non-RCV cities, according to a 2021 study by researchers in Iowa and Wisconsin. They attribute the cause to greater campaign civility and mobilization and increased contact in RCV elections. (See Ranked Choice Voting and Youth Voter Turnout: The Roles of Campaign Civility and Candidate Contact. Juelich, C & Coll, J. June 2021.)
- A 2025 study finds that RCV does not lower turnout among people of color: “If anything, our results suggest that people from each race/ethnic group examined here had higher rates of turnout in RCV cities than these groups had in other places.” See Is Ranked-Choice Voting Associated With Turnout Across Race/Ethnic Groups? Dowling, Tolbert, Micatka, and Donovan. 2025.
- When compared to the primary and runoff elections they replace, RCV general elections are associated with a 8-point increase in voter turnout, according to a 2016 study by researchers at the University of Missouri in St. Louis. They found RCV did not affect inequities in turnout. (Read our one-page summary here, or see Voter Participation with Ranked Choice Voting in the United States. Kimball, D & Anthony, J. October 2016.)
- In 2018, San Francisco held a highly competitive special mayoral election at the same time as statewide primaries for governor and senator. More San Franciscans participated in the city’s RCV mayoral election than in non-RCV primaries at the top of the ballot, demonstrating that a competitive RCV election can drive turnout, according to FairVote’s analysis.
- Our analysis of RCV races in the six largest U.S. cities using RCV found stronger turnout in RCV races than those held before RCV implementation and compared to concurrent races in non-RCV cities. We did not control for other factors, such as competitiveness of races on the ballot, which could drive turnout.
Voter engagement
- Voters in RCV jurisdictions are more likely to be contacted by campaigns, an important measure of voter engagement. (See Does ranked choice Voting Increase voter turnout and mobilization? Dowling, Tolbert, Micatka, and Donovan. August 2024.)
- The 2021 study that found RCV boosts youth turnout attributed the increase to mobilization and increased voter contact in RCV elections. (See Ranked Choice Voting and Youth Voter Turnout: The Roles of Campaign Civility and Candidate Contact. Juelich, C & Coll, J. June 2021.)
- Candidates in RCV cities are more likely to reach out to voters in person than those in cities that do not use RCV. Additionally, voters in RCV cities were more likely to discuss politics with their families, friends or co-workers than voters in cities that do not use RCV. (See Ranked Choice Voting and Participation: Impacts on Deliberative Engagement. Smith, Haley. June 2016.)
Additional reading:
- Ranked choice voting in practice: Analysis of voter turnout in RCV elections, by Elliot Louthen (2015).
- The adoption of RCV raised turnout 10 points, FairVote.
- Key facts about the use of ranked choice voting in 2014 in California’s Bay Area, FairVote, 2014.
RCV ballot use
This section explores how voters use the ranked ballot, including number of candidates ranked and ballot error.
Number of rankings used
In ranked choice voting elections, voters have the option to rank as many or as few candidates as they choose. In practice, most voters choose to rank multiple candidates. The number of voters who choose to rank multiple candidates can indicate public understanding and enthusiasm for ranked choice voting.
At the same time, voters may vote for only one candidate if they so wish. This can be an active choice, meaning voters who don’t rank multiple candidates aren’t necessarily lacking understanding.
- Our research regularly tracks how many voters choose to rank multiple candidates across all RCV elections in the U.S.
- A median of 68% of voters rank multiple candidates.
- In highly competitive elections (those with 5+ candidates), even more votes rank multiple candidates (74%).
- 72% of RCV voters in the 2020 Democratic presidential primaries ranked multiple candidates, even though Joe Biden was already the presumptive nominee by the time voting began in the four RCV states.
- A 2021 study by FairVote found that voters of color tended to use more rankings in 2020 elections than White voters. In all elections in the study, voters of all racial and ethnic groups ranked at least half of the candidates on the ballot. (See Ranked choice voting elections benefit candidates and voters of color. FairVote. 2021.) This finding was repeated in FairVote’s analysis of 2021 New York City elections.
- Black, Latino, and Asian American voters were more likely to fully rank their ballots in San Francisco, according to California researchers. (See Whose votes count?: Undervotes, overvotes, and ranking in San Francisco’s instant-runoff elections by Francis Neely and Corey Cook. 2008.)
- Australian voters in states without compulsory ranking tend to follow party recommendations when choosing how many candidates to rank, according to a 2021 study in Australia.
- The proportion of “single rankings” by Labor party voters, for example, reached 72% in elections for which the Labor Party’s campaign material recommended single rankings. That rate fell sharply when the Labor Party’s materials instead recommended additional rankings.
- A similar effect occurred in 2018 in Maine’s 2nd district RCV election, in which incumbent Bruce Poliquin signaled anti-RCV sentiment and subsequently did not earn as many second- and third-choice rankings as his more RCV-friendly rivals.
- (See Ranked choice voting in Australia and America: Do voters follow party cues? by Benjamin Reilly. 2021.)
- Voter education materials are effective for both informed and uninformed voters in RCV elections and can impact ballot use, according to a 2021 experimental study. The study finds that participants who received a voter guide detailed the candidates’ stances on various issues used more rankings and voted for candidates better aligned with their own political views. The study also found that voters’ top choices tend to be a good reflection of the voter’s policy views, but disparities exist between voters classified as informed and uninformed (based on individuals’ knowledge of local issues). Additionally, the voter guide closed the gap between informed and uninformed voters. (See Ranked-Choice Voting and Political Expression: How Voting Aids Narrow the Gap between Informed and Uninformed Citizens by Cheryl Boudreau, Jonathan Colner, and Scott Mackenzie. March 2021.)
- Voters use their rankings, whether they vote in person or by mail. According to FairVote’s own research, the number of rankings used differed by less than ten percent between mail-in and in-person voting across Alaska, New York City, and four California cities (Albany, Berkeley, Oakland, and San Francisco). On average, mail-in voters used slightly more rankings, demonstrating that voters take advantage of their RCV ballots even without polling-site instruction.
- In Maine’s first two RCV election cycles, most voters ranked candidates, the proportions of blank ballots were the same as in Maine’s prior non-RCV election, and many voters used multiple rankings to cross party lines. (See An analysis of ranked choice voting in Maine, by Matt Germer, September 2021)
Ballot error
This section examines research into voter error as a measure of voter participation. All ballot types result in some voter errors. In single-choice elections, ordinarily only overvotes — invalidated ballots because voters attempted to vote for more candidates than are allowed — count as ballot errors.
In RCV elections, voters may make other types of marks, including skipping rankings or including overvotes at later ranking orders. However, most of these ballots are counted as the voter intended. For example, if a voter leaves their second ranking blank but provides a third ranking, the third ranking will be counted as the voter’s second ranking.
Only first-round overvotes are comparable to errors in single-choice elections, since those are the only errors that, in both systems, invalidate the ballot entirely. In other words, if a ballot is invalidated in a later round of RCV, the ballot is no less valuable in determining the outcome than it would be in our current system of plurality voting.
Overall, research indicates that ballot error in RCV elections follows the same pattern as errors in non-RCV elections. In all single-winner RCV elections in the U.S. with 3+ candidates, the median first-round A ballot that indicates a preference for more than the maximum number of selections allowed. Under Ranked Choice Voting, this means the voter has ranked more than one candidate at the same ranking order. In Single-Choice Plurality, it means the voter has voted for more than one candidate.Overvote rate is 0.2%.
According to professors at Utah Valley University, “relatively few ballots in RCV elections contain an error, and even fewer ballots are rejected,” but “if RCV and single-choice voting differ in terms of ballot error, that difference should be weighed against the fact that RCV makes more ballots count meaningfully. Recent research shows that RCV causes an average of 17% more votes to directly affect the outcome between top candidates.”
- Errors on ranked choice ballots reveal no significant differences when comparing racial and ethnic groups, according to a 2020 study. The author concludes that the evidence suggests blank rankings on a ballot may be a choice rather than evidence of difficulty casting a ballot. (See Demographic Disparities Using Ranked Choice Voting? Ranking Difficulty, Under-Voting, and the 2020 Democratic Primary, by Joseph Coll. June 2021.)
- Ranked ballots and score ballots produced more valid votes than traditional choose-one ballots according to a 2020 survey experiment. Additionally, ranked ballots were associated with smaller discrepancies in error-proneness according to race and gender. Find a research brief by the author here. (See Voting Error Across Multiple Ballot Types: Results from Super Tuesday (2020) Experiments in Four American States, by Jason Maloy. October 2020.)
- Ranked ballots do not raise the probability that a voter would cast a void (uncountable) vote, despite raising the probability of at least one violation of voting instructions. (See The Impact of Input Rules and Ballot Options on Voting Error: An Experimental Analysis by J.S. Maloy and Matthew Ward. June 2021.)
- The adoption of RCV was not associated with any change in the number of Votes that cannot be counted for a specific contest. There are multiple types of residual votes, including Overvotes and Undervotes.Residual Votes, including overvotes and undervotes, in a 2016 study of 26 cities. (See FairVote’s one-page summary here or see Voter Participation with Ranked Choice Voting in the United States, by David Kimball and Joseph Anthony. October 2016.)
- Patterns of overvoting are similar in both RCV and non-RCV contests, according to a 2015 study. With both voting methods, overvotes are more common in precincts with more African-American, Latino, elderly, foreign-born, and less wealthy citizens. (See Overvoting and the Equality of Voice under Instant-Runoff Voting in San Francisco, by Francis Neely and Jason McDaniel. 2015.)
Inactive ballots
Inactive ballots — also known as “exhausted” ballots — occur when ballots can’t be counted for a candidate in a given round of vote tabulation. The more active ballots that are in play in the final round, the more utility those ballots have in deciding the outcome. Ballots can become inactive in three ways:
Voters are permitted to rank as many choices as they want, but they have the right to not rank candidates beyond those they support. Thus, we could also consider ballots exhausted by voluntary abstention as ballots exhausted “by choice.” Therefore, these ballots are not problematic for RCV, but rather an indication of voter choice – the choice to express preferences for multiple candidates (a choice option that does not exist under plurality voting).
We analyzed all single-winner RCV races in the U.S. between 2004 and 2024 and found that few votes become inactive due to either ranking limits or ballot error. Voluntary abstention is by far the most common source of inactive votes.
- Total impact of inactive ballots in RCV races: When combining single-round and multi-round races, the data set includes 400 elections that released full ballot data and had 3+ candidates, including over 20 million ballots. The total impact of inactive ballots is as follows, on average:
- 4.5% inactive by voluntary abstention
- 1.2% inactive by ranking limit
- 0.06% inactive by error
- In races with multiple rounds of tabulation: We have complete data for over 200 single-winner races that used multiple rounds to determine a winner, including 15 million ballots. For those races, we found the following average rates of inactive ballots:
- 7.7% inactive by voluntary abstention
- 2.1% inactive by ranking limit
- 0.1% inactive by error
- Compared to two-round runoff elections, RCV makes many more votes count. In runoff elections, participation typically declines by nearly 40% because not all voters turn out to vote a second time. In RCV, also known as “instant runoff voting,” every voter has the option to rank the candidates, and the decline in participation is less than 10% (as measured by “voluntary abstention” above.)
Other research on inactive ballots:
- According to a 2026 study of over 100 recent U.S. RCV elections, “probabilistic completion of exhausted ballots—using several different models of voter preferences—indicated that completing exhausted ballots would be very unlikely to alter the outcomes, indicating robustness to ballot incompleteness. Thus, RCV’s vote transfer mechanism functioned effectively in practice, successfully aggregating voter preferences despite incomplete rankings in the vast majority of elections.” (See Simpler Than You Think: The Practical Dynamics of Ranked Choice Voting by Sanyukta Deshpande, Nikhil Garg, Sheldon Jacobson. 2026.)
- A 2015 paper highlights ballot exhaustion in RCV elections, but only examines four elections rather than considering the full range of RCV elections. Even with the limited scope of this work, the the authors correctly note that many exhausted ballots result from jurisdictions limiting the number of rankings to three. (See Ballot (and voter) “exhaustion” under Instant Runoff Voting: An examination of four ranked-choice elections, by Craig Burnett and Vladimir Kogan. 2015.)
Strategic voting
- “RCV is not easily manipulable in practice,” according to a 2024 paper. (See Optimal Strategies in Ranked Choice Voting by Sanyukta Deshpande, Nikhil Garg, and Sheldon H. Jacobson)
- With RCV, voters have no incentive to vote strategically (i.e. submit a ballot that is different from their actual preferences) if their goal is to elect candidate(s) who match their preferences, according to a 2024 study. (See Voting when Rankings Matter: Truthful Equilibria, Efficiency, and Abstention by Roland Pongou and Ghislain Junior Side).
- “Manipulability is rarely a concern in practice” and “affect a relatively small enough number of voters that attempting to manipulate an election . . . seems like an absurd strategy,” according to a 2023 empirical study that examines American RCV elections. (See: An Examination of Ranked Choice Voting in the United States, 2004-2022 by Adam Graham-Squire and David Mccune).
- “(RCV) is less susceptible to strategic voting on average than plurality, in the sense that it creates smaller average incentives to vote strategically”, according to a 2023 study. (See Susceptibility to strategic voting: a comparison of Plurality and instant-runoff elections by Andrew C. Eggers and Tobias Nowacki).
- In their 2025 analysis of roughly 4,000 real RCV elections in the U.S. and abroad, as well as millions of simulated elections using survey data from the Cooperative Election Study, researchers at the Institute for Mathematics and Democracy found that RCV is “not susceptible” to strategic voting tactics such as A ballot in which the voter has selected only one candidate, despite the option to indicate a preference for more than one candidate.Bullet Voting – ranking only a favorite candidate to avoid helping others – or burying – ranking a strong opponent lower to hurt their chances. (See: Empirical Analysis of Ranked Choice Voting Methods by David McCune, Andy Schultz, and Ismar Volić).
Voter support and understanding
This section examines how well voters understand ranked choice voting and their level of satisfaction with it.
Below is a collection of exit poll and survey results from cities and states using RCV around the country. (The data is summarized in downloadable format here.)
- Alaska: In 2024, 84% of voters said RCV is simple. In 2022, 85% of voters said RCV is “simple” in their first RCV election, and a majority said their vote mattered more than in previous years. This sentiment was consistent across region, race, gender, and age, though Alaska Native voters were most likely to say their vote mattered more.
- Maine: In 2024 and 2022, 82% of voters said RCV is easy. In 2024, 57% liked having the ability to rank candidates. In 2018, 90% of primary voters said their experience with RCV was “excellent” or “good.”
- New York, NY: In 2025, 96% of voters found their ballot simple to complete. 76% wanted to keep or expand RCV, with 42% wanting to expand it to general elections and 34% wanting to keep it only for primaries. In 2021, 95% of voters found their ballot simple to complete, and 77% supported using RCV in future local elections.
- Charlottesville, VA: In 2025, 89% of voters supported using RCV in future elections following their first use of RCV.
- Redondo Beach, CA: In 2025, 87% of voters said they understood RCV well, and 61% said they favor RCV.
- California Bay Area RCV cities: In 2024, 92% of voters understood RCV well, and 70% wanted to keep or expand RCV. In 2013 and 2014 surveys, 90% and 89% found RCV easy.
- Arlington, VA: In 2024, 88% of voters said RCV is easy, and 67% supported using it in future elections.
- Portland, OR: In 2024, voters preferred RCV to the previous voting method by more than a 2-to-1 margin (63%-28%). 91% of voters understood RCV.
- Utah cities: In 2023, 94% of voters were satisfied with RCV. 82% said it is easy, and 67% said they were more likely to vote for their favorite candidate because of RCV. In 2021, 81% of survey respondents said RCV was somewhat or very easy, and 90% said the instructions on the ballot were clear.
- Boulder, CO: In 2023, 86% of voters said RCV was easy. 77% were satisfied with their voting experience.
- Virginia Republicans: In 2022, 56% of Virginia Republicans who used RCV in congressional primaries reported that they prefer RCV to single-choice elections.
- Minneapolis, MN: In 2021, 88% of voters found RCV simple. 76% wanted to continue using RCV. In 2017, 92% found RCV simple. 84 percent said they liked and wanted to continue using RCV.
- Santa Fe, NM: In 2018, 94% of voters reported feeling “very satisfied” or “somewhat satisfied” with their first use of RCV.
- Eastpointe, MI: In 2019, 85% of voters found RCV simple.
Additional research on voter support and understanding of RCV:
- In Bay Area RCV cities, the percentage of voters who understand RCV “well” or “somewhat well” (92%) is higher than the number who say they understand top two voting (86%), which California uses for state and federal elections. (See Poll shows Bay Area voters like ranked choice voting and are interested in proportional representation, by FairVote, 2025; and Socioeconomic and demographic perspectives on Ranked Choice Voting in the Bay Area, by Sarah John and Caroline Tolbert, 2015.)
- There are no differences in RCV cities in how White, Black, and Latino respondents reported understanding RCV. (See Self-reported understanding of ranked-choice voting, by Todd Donovan, Caroline Tolbert, and Kellen Gracey, 2019.)
- Older survey respondents were voters were less likely to leave blank rankings on their ballots, but were slightly more likely to report difficulty with the ranked ballot. No significant relationships were found across racial and ethnic groups. (See Demographic disparities using ranked choice voting? Ranking difficulty, under-voting, and the 2020 Democratic Primary, by Joseph Coll, 2021.)
- Some voters have a status quo bias toward supporting single-choice voting, but recent research has also found that voters who have used RCV are more positive toward it. (See Public Perceptions of Alternative Voting Systems: Results from a National Survey Experiment, by David Kimball and Joseph Anthony, April 2021, and Choosing to Vote as Usual, by Andre Blais, Carolina Plescia, and Semra Sevi, February 2021.)
- Proportional representation and RCV can decrease the “perceived legitimacy gap” following elections, meaning election winners and losers are in closer agreement that the election is legitimate. (See Electoral Systems and Political Attitudes: Experimental Evidence, by Sean Fischer, Amber Lee, and Yphtach Lelkes, May 2021.)
- Using data from the Cooperative Election Study, a University of Minnesota researcher found that “voters in RCV jurisdictions generally possess baseline political knowledge about incumbents and can effectively translate ideological preferences into electoral rankings.” (See Information and Ideology: Evaluating Voter Capacity under Ranked Choice Voting by Daniel Song).
For research on how voters interact with the ranked ballot in practice, see Data on RCV: Ballot Use.
Representation
Research shows that RCV improves representation for women, people of color, and other groups.
Representation for women and people of color
- Candidates of color gain more votes in the round-by-round counting process than White candidates, indicating consensus-building, according to a 2021 FairVote study. Additionally, candidates of color in RCV elections pay no penalty when competing against other candidates of the same racial or ethnic group. (See Ranked choice voting elections benefit candidates and voters of color, FairVote. 2021.)
- The proportional form of RCV increased women’s representation in cities that used it in the early 20th century, according to a 2021 study. The study also shows that the single-winner version of RCV has been effective at increasing women’s representation in the 21st century. (See Election Reform and Women’s Representation: Ranked Choice Voting in the U.S, by Cynthia Terrell, Courtney Lamendola, and Maura Reilly. 2021.)
- Cities with RCV have better overall electoral outcomes for women and people of color, according to a 2020 study by RepresentWomen. Over the last decade, women have won 48% of all municipal ranked choice elections. As of April 2020, nearly half of all mayors (46%) and city council seats (49%) decided by RCV are held by women. By comparison, women comprise only 23% of mayors in non-RCV jurisdictions. (See In Ranked Choice Elections, Women WIN, by RepresentWomen. 2020.)
- California cities that adopted RCV saw increases in the percentage of candidates of color running for office and in the probability of female candidates and female candidates of color winning office, according to a 2018 study. (See The alternative vote: Do changes in single-member voting systems affect descriptive representation of women and minorities?, by Sarah John, Haley Smith, and Elizabeth Zack. 2018.)
- People of color hold office at a higher rate under RCV, according to a 2019 FairVote report on RCV in California cities. (See Ranked Choice Voting and Racial Minority Voting Rights, FairVote. 2019.)
- RCV voters in presidential primaries used rankings to identify the strongest presidential nominee while ensuring diverse representation at the national convention, according to a study on the 2020 Democratic presidential primaries. (See Ranked-Choice Voting Delivers Representation and Consensus in Presidential Primaries, by Baodong Liu, Nadia Mahallati, and Charles Turner. 2021.)
- Candidates of color appear to earn lower support than White candidates in both plurality elections and RCV elections. A survey experiment from 2021 finds that RCV does not ameliorate that penalty, penalties were significantly lower for respondents who displayed a high level of understanding of RCV. Adding partisan labels to the candidates also significantly reduces the penalty. (See Ranking Candidates in Local Elections: Neither Panacea nor Catastrophe by Melody Crowder-Meyer, Shana Kushner-Gadarian, and Jessica Trounstine. 2021.)
- Proportional RCV benefited candidates from ethnic and political minority groups, according to a 2014 FairVote report. The reason: proportional RCV’s low electoral The minimum number of votes needed to win a seat under various Multi-Winner voting methods. In Proportional Ranked Choice Voting, the threshold is the fewest votes that only the winning number of candidates can obtain, typically calculated using the Droop Quota. In List Proportional Representation, the threshold is the minimum needed for a party to win any seats and is known as the threshold of exclusion.Threshold allows people of color to have representation based roughly on their share of the population. (See The Effect of Fair Representation Voting on 2013 Cambridge Municipal Elections, by Andrew Douglas. 2014.)
- RCV increases descriptive representation for women, people of color, and women of color, according to a 2016 FairVote report. This is because RCV is often used to replace unrepresentative, low-turnout elections and that it allows multiple candidates appealing to the same community to run without splitting the vote. (See Ranked Choice Voting and Representation of Underrepresented Groups, by Sarah John, Haley Smith, and Elizabeth Zack. 2016.)
- RCV does not decrease racially polarized voting, according to two studies (here and here). Racially polarized voting occurs when voters of different racial or ethnic groups vote distinctly from one another. These results are unsurprising because RCV tends to attract more diverse candidates, giving voters more opportunity to cast a vote for someone who represents their community. (See Does More Choice Lead to Reduced Racially Polarized Voting? Assessing the Impact of Ranked-Choice Voting in Mayoral Elections, by Jason McDaniel. (October 2018) and Does Ranked-Choice Voting Reduce Racial Polarization? A Clustering Approach to Ranked Ballot Data, by Yuki Atsusaka and Theodore Landsman. (April 2021).
- Proportional RCV, also known as single transferable vote or STV, tends to elect candidates of choice for people of color in proportion to their share of the population, according to a2021 study. The authors note that proportional RCV will stably and reliably secure representation for people of color, whereas single-winner districts can have a wide range of performance and it is difficult to produce district maps that hold up over time with respect to voter turnout and residential shifts. These concerns are not present with proportional RCV, because proportionality is a structural property. (See Ranked Choice Voting and Proportional Representation, by Gerdus Benade, Ruth Buck, Moon Duchin, Dara Gold, and Thomas Weighill. 2021.)
Representation for political viewpoints
More than one-third (35%) of voters are Independents, yet they have little influence in government because it is difficult for Independent candidates to get elected under plurality voting rules. RCV can improve their representation at the state and federal levels of government, allowing supporters of Independent and third-party candidates to rank their preferred candidate first without “wasting” their votes or “spoiling” the election outcome.
The theory and scholarship behind how RCV (particularly the single-winner version) can otherwise impact ideological representation is mixed. At worst, the effect is neutral.
Related research:
- A 2025 study assesses Alaska’s use of a nonpartisan primary and RCV general election. The authors find the system has provided more choice for voters and impacted both electoral outcomes and public policy, with winning candidates more likely to work across the aisle and cross-party majority caucuses emerging in both legislative houses. See Assessing Alaska’s Top-4 Primary and Ranked Choice Voting Electoral Reform: More Moderate Winners, More Moderate Policy by Glenn Wright, Benjamin Reilly, and David Lublin. 2025.
- Independent and third-party candidates fare better under RCV elections, according to a 2021 study. However, respondents in a survey experiment reacted negatively to the idea of a come-from-behind victory in an RCV election while feeling no dissatisfaction with come-from-behind victories in two-round runoffs or non-majority winners in plurality elections. In actuality, non-majority winners in plurality elections can be a key driving force behind implementation of RCV, indicating voters are in fact dissatisfied with the status quo. (See Ranked-Choice Voting, Runoff, and Democracy: Insights from Maine and Other U.S. States by Joseph Cerrone and Cynthia McClintock. 2021.)
- A national survey experiment testing voter behavior in the 2020 presidential election found that ranked-choice voting (RCV) increases support for third-party candidates. Respondents were randomly assigned to vote using either a non-RCV or RCV ballot among Joe Biden, Howie Hawkins, Jo Jorgensen, and Donald Trump, and nearly twice as many voters in the RCV group chose a third-party candidate – a statistically significant relationship. A probability model in the same study found that RCV increased the likelihood of voting for a third-party candidate by nearly 400%. (See Ranked-Choice Voting and the Potential for Improved Electoral Performance of Third-Party Candidates in America by Alan James Simmons, Manuel Gutierrez, John E. Transue. 2022.)
- RCV does not lead to more support for extreme candidates, according to a 2021 study. Ideologically extreme candidates are not viewed as more electable in RCV elections than in plurality elections, among both liberals and conservatives. (See Voters Evaluate Ideologically Extreme Candidates as Similarly Electable under Ranked Choice Voting and Plurality Voting, by Melissa Baker. 2021.)
- A study of municipal RCV use in nine cities found that RCV had no apparent impact on ideological composition of city councils in those cities, and does not appear to change councilors’ voting behavior. The study questions whether RCV will in fact improve ideological representation, but notes that it only considers progressive cities, and further research on other cities and statewide implementation will be informative. (See Electoral Institutions and Substantive Representation in Local Politics: The Effects of Ranked Choice Voting by Arjun Vishwanath. 2021.)
- RCV may also reduce legislative polarization by allowing space for moderate, conservative, liberal and other voters to elect candidates in proportion to their overall numbers in the electorate, according to a 2016 FairVote report. Evidence from Cambridge, Massachusetts, which uses proportional RCV, indicates that candidates and city councilors there are not highly polarized. (See Polarization and Multi-winner Ranked Choice Voting in Cambridge, Massachusetts, City Council Elections, by Sarah John and Brandon Leinz. 2016.)
Evaluating RCV election outcomes
This section explores how RCV works in practice in the United States, particularly the types of outcomes it produces. The section assesses RCV’s success at electing majority winners, evaluates whether incumbent candidates succeed in RCV elections, and explores come-from-behind wins, as well as RCV’s impact on technical grounds, namely monotonicity and its tendency to elect Condorcet winners.
Majority winners
Majority rule is a fundamental principle of our democracy. However, our current system often elects winners with less than majority support or even less than half of the votes. Between 1992 and 2019, 49 senators from 27 states were elected with less than 50% support.
Primary elections in particular can lead to nominees with small pluralities. Because votes are often split between many candidates, it often takes a relatively small proportion of votes to win. In some highly-contested races, winners earn as little as 22% of the vote, meaning 78% of people voted against them, but this small plurality is enough to win the nomination in an election with many candidates. This chart shows plurality wins in primary elections for the U.S. House of Representatives in 2024.
Ranked choice voting solves this problem by requiring that the winner receives over 50% of votes active in the final round, therefore electing nominees and candidates with the broadest support.
Majority winners in RCV elections
- There have been roughly 500 single-winner ranked choice elections in the United States that included at least three candidates (meaning no candidate can win a majority by default. When there are two candidates, one candidate must mathematically win over 50% of votes, except in the event of a tie). A majority winner was identified in the first round in about 40% of these races. The remaining 60% races were decided by instant runoff before declaring a winner.
- Sometimes, winners of RCV elections don’t earn a majority of total votes cast. A winner is declared when a candidate has a majority of votes active in a given round of counting (excluding ballots that have become inactive). This has occurred in roughly one-third of single-winner RCV elections in the United States. In these races, the winner was preferred by a majority of voters who expressed a preference between the finalists.
Inactive ballots occur more often when jurisdictions limit the allowed number of rankings. Half of the elections in which the winner earned less than 50% of total ballots cast in the first round occurred in elections where voters were limited to only 3 choices. Learn more about the One of the criteria used to evaluate voting methods. The majority criterion is satisfied if, when there exists a candidate who is the preferred by more than half of voters, that candidate always wins. A stricter version of the majority criterion is the mutual majority criterion.Majority Criterion with RCV in our FAQ.
Consensus value
“Consensus value” is the portion of voters who rank the winner as their first, second, or third choice. We use this value to measure how much support winning candidates garnered from the community as a whole. This measure tells us how many voters find winning candidates acceptable.
- In single-winner RCV races, nearly two in three RCV winners has the consensus of two-thirds of voters.
- In single-winner races for which we have enough data to determine consensus value, 78% of ballots ranked a winning candidate in their top three.
- In proportional RCV races, 93% of voters ranked at least one winner in their top 3 choices. This rate is higher for elections that elect more seats (95% of voters in races electing six or more seats) than in races with fewer winners (89% in races electing 2-3 winners). Source: FairVote’s RCV Elections Database, proportional RCV tab.
Incumbency
- A 2021 report found that a city’s use of RCV is not a significant factor in the likelihood of incumbent candidates winning reelection. (See Ranked Choice Voting and Incumbent Success, by FairVote. 2021.)
- RCV has a neutral effect on incumbents, according to 2017 work by FairVote. Incumbents are re-elected at the same rate both with and without RCV. (See RCV and Incumbency in the Bay Area, by FairVote California. 2017.)
Come-from-behind winners
A “come-from-behind” winner is a candidate who did not have the most votes in the first round, but secured enough second, third, or other choice preferences to win in a later round.
A “come-from-behind” winner is a natural feature of RCV that means it is working how it is supposed to, that is, rewarding candidates with broad support over those who can only win by small pluralities. Nonetheless, the first-round winner is most often the overall winner.
- Since 2004, 32 RCV races were won by a candidate other than the first-round leader. That amounts to 6% of all single-winner RCV races with 3+ candidates, and 9% of all races that used multiple rounds of counting.
- Compare this with the rate of come-from-behind wins in two-round runoff elections, estimated at 33% in congressional primary runoffs.
- Of the 32 come-from-behind wins in RCV elections, 30 were won by the candidate who began in second place.
- Two races were won by the candidate who began in third place: San Francisco’s 2010 election for the 10th District which elected Malia Cohen, and San Francisco’s 2020 election for the 7th District which elected Myrna Melgar. Analysis of ballot data reveals that both would have won head-to-head match-ups against any other candidate in those elections, making them the “The candidate who would defeat every other candidate in a head-to-head or pairwise election. Election methods which always elect the Condorcet Winner if one exits are known as Condorcet Voting methods.Condorcet Winner” or “beats-all” winner. These two cases are examples of RCV electing a Condorcet winner when a two-round runoff election would not have done so.
- Come-from-behind wins happen more often in Alaska where candidates of the same party are likely to face each other in general elections. Alaska uses “top-four RCV,” where four candidates regardless of party compete in the general election. In all of Alaska’s come-from-behind wins to date, the eventual winner is from the party that earned the most first-choice preferences.
- This chart shows all come-from-behind victories in the United States since 2004:
“Condorcet” winners
The One of the criteria used to evaluate voting methods. The Condorcet criterion is satisfied if, when there exists a candidate who would defeat every other candidate in a head-to-head election, that candidate always wins. Such a candidate is known as a Concordet Winner.Condorcet Criterion states that the candidate who would win a one-on-one matchup against every other candidate should win the election. RCV does not guarantee that the “Condorcet candidate” or “Condorcet winner” will win, but it does make it extremely likely, and certainly out-performs traditional elections. Nonetheless, the Condorcet criterion is only one of many criteria we could use to evaluate an electoral system.
- It’s unclear how often single-choice plurality (our current voting method) or two-round runoff elections elect Condorcet winners because voters’ back-up choices are not publicly disclosed.
- Of the over 400 single-winner RCV elections in the United States since 2004 in which we have sufficient ballot data to assess the Condorcet criterion, all but two were won by the Condorcet candidate. The two elections that did not elect the Condorcet candidate are the 2009 mayoral election in Burlington, Vermont and the 2022 special election for U.S. House in Alaska.
- In the rare instances where RCV does not elect the Condorcet candidate, that candidate must have attracted too little core support to place first or second in the final round. These discrepancies are rare, but when they occur it is for a good reason. RCV prioritizes candidates with both broad support and deep support, while Condorcet winners only need to have broad support. When the two methods differ, it is necessarily because of a lack of deep support for the Condorcet candidate.
- In the Burlington election, the three strongest candidates (after all others were eliminated) had 37%, 34%, and 29% support. The third-place candidate, Andy Montroll, was eliminated. After the election, An electronically produced record of all votes cast by a single voter. Related concept: Cast Vote Record (CVR).Ballot Image Data showed that supporters of the top two candidates overwhelmingly ranked Montroll ahead of the other finalist, making Montroll the Condorcet candidate. It may be disputed whether it would have been better for Montroll to win the election despite attracting so little core support. However, it is certain that Montroll would have also lost under a two-round runoff election or a single-choice plurality election.
- In the 2022 special election for U.S. House in Alaska, the last-place candidate was Republican Nick Begich, eliminated in the first round. He trailed the leader, Democrat Mary Peltola, by 12 points. Ballot data later revealed that Begich was a popular second choice for Peltola voters, and voters for the other Republican, Sarah Palin. 52.5% of voters (who had a preference) ranked Begich higher than Peltola, and over 60% of voters ranked Begich higher than Palin. That makes Begich the Condorcet winner, but nonetheless a candidate with low support as a top choice. RCV did not elect Begich because he was in last place – the last-place candidate will never win in RCV. Begich almost certainly would have also lost under Alaska’s previous voting method, where he would have lost to Sarah Palin in the Republican primary.
- Two RCV races elected the Condorcet winner when a two-round runoff would not have done so. In these races, both winners began in third place and finished in first place after the RCV tally. They are Connie Chan from San Francisco’s 10th district in 2010 and Myrna Melgar from San Francisco’s 7th district in 2020. In each case, a two-round runoff election would not have allowed the Condorcet winner to advance to the final round.
- There are two RCV races for which there was no Condorcet winner, meaning there is no candidate who would have beaten every other candidate in a head-to-head match-up. Those are the 2022 Oakland School Board District 4 election and the 2021 Minneapolis City Council Ward 2 election.
- In their 2025 analysis of roughly 4,000 real RCV elections in the U.S. and abroad, as well as millions of simulated elections using survey data from the Cooperative Election Study, researchers at the Institute for Mathematics and Democracy found that “in real elections, if a Condorcet candidate exists then IRV almost always chooses this candidate.” Their simulations show RCV has the potential to fail to select the Condorcet winner, but “still performs well” and that “due to candidate behavior, it is not clear how often this would occur in practice if more jurisdictions adopted (RCV).” The authors conclude that “regardless of context, (RCV) chooses ‘strong’ candidates by either selecting the Condorcet winner or choosing a candidate with a large base of core support.” (See: Empirical Analysis of Ranked Choice Voting Methods by David McCune, Andy Schultz, and Ismar Volić).
The “monotonicity criterion”
Monotonicity means that ranking candidates lower doesn’t help them and ranking them higher doesn’t hurt them. Any voting method in which votes are counted in rounds — including RCV and two-round runoff elections — can have nonmonotonic outcomes but the realities of RCV in practice make it extremely unlikely.
To our knowledge, no group of voters in an RCV election has ever attempted to exploit the possibility of nonmonotonicity for strategic purposes. Doing so successfully requires highly unusual circumstances and a detailed and accurate prediction of how the electorate will rank the candidates. Such a degree of hindsight or voter control does not exist. As such, monotonicity under RCV is a largely academic question: it has never impacted an RCV campaign and is unlikely to impact a future one. Learn more in our FAQ.
Of some 500 RCV elections in the United States with 3 or more candidates, there are claims that two had a possibly non-monotonic outcome: the 2009 mayoral race in Burlington, Vermont and the 2022 special election for U.S. House in Alaska.
Below are results from the Burlington election.
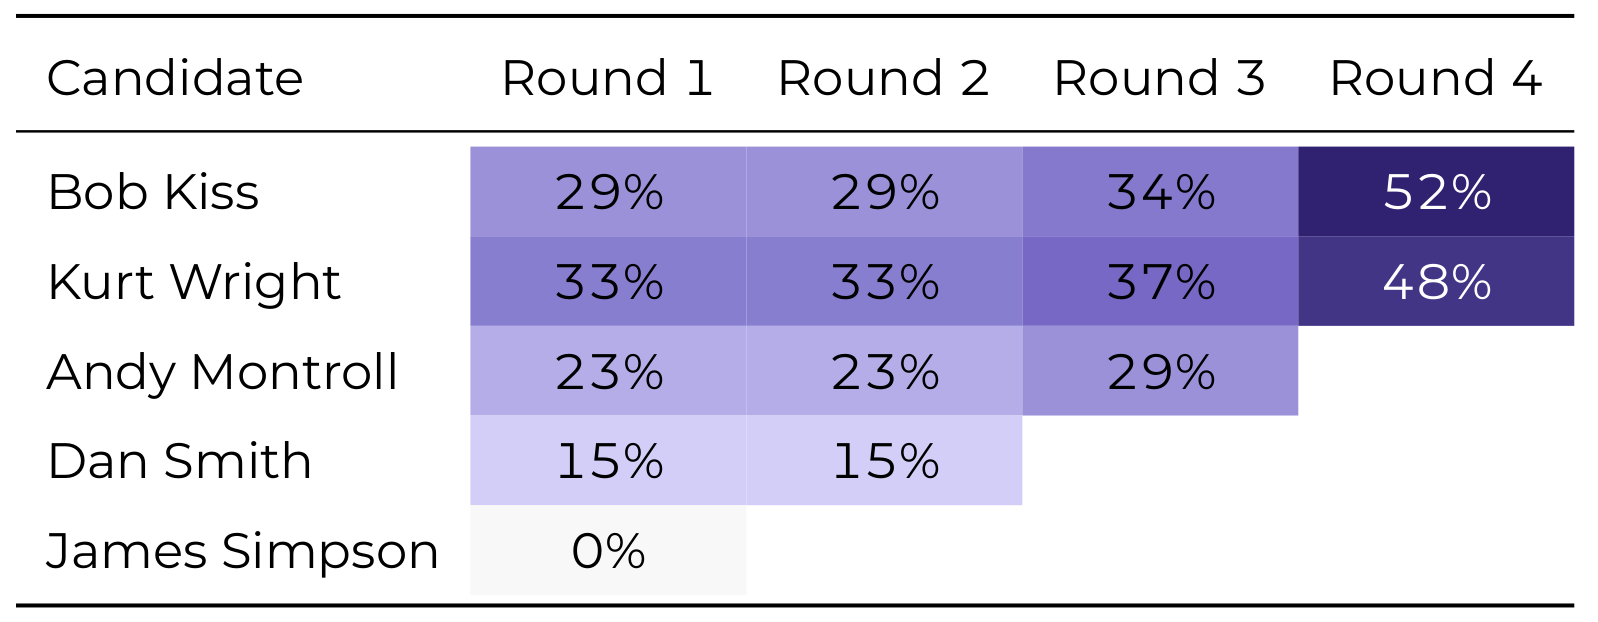
Whether this election constitutes a non-monotonic outcome depends on how strictly the criterion is defined. No candidate could have won if voters merely ranked them lower. However, if some Wright voters (between 367 and 589 voters) had instead ranked Kiss first (and changed no other ballots), Wright would have been eliminated instead of Montroll, and Montroll would have beaten Kiss. In other words, a group of Wright voters could have caused Kiss to lose by ranking him higher. However, this would be Wright voters helping to elect Montroll. No group of voters could have elected their own preferred candidate by ranking them lower.
A similar situation arose in the 2022 special election for U.S. House of Representatives in Alaska. No group of voters could have helped their preferred candidate win by ranking them lower, but a group of voters could have helped some other candidate win (Nick Begich) by ranking them lower.
Monotonicity is “rarely a concern in practice” and “affect a relatively enough small enough number of voters that attempting to manipulate an election in this fashion seems like an absurd strategy,” according to a 2023 empirical study that examines American RCV elections. (See: An Examination of Ranked Choice Voting in the United States, 2004-2022 by Adam Graham-Squire and David Mccune).
In their 2025 analysis of roughly 4,000 real RCV elections in the U.S. and abroad, as well as millions of simulated elections using survey data from the Cooperative Election Study, researchers at the Institute for Mathematics and Democracy found that monotonic “paradoxes rarely occur in real elections . . . Furthermore, when these paradoxes do occur, it seems impossible to engineer them in advance.” (See: Empirical Analysis of Ranked Choice Voting Methods by David McCune, Andy Schultz, and Ismar Volić).
Evaluating electoral systems on criteria like Condorcet and monotonicity are certainly interesting (though often hypothetical) exercises. However, as per Arrow’s Impossibility Theorem, no method of group decision-making can meet every criteria in every circumstance. Therefore, we caution not to get too “stuck” on niche scenarios like the above when overall, RCV has proven success at electing broadly popular consensus candidates (as shown on this page).
Increased campaign civility
Ranked choice voting (RCV) encourages civil discourse because candidates campaign not only for first- but also second-choice support. Consequently, candidates are incentivized to appeal to a broader range of voters and to avoid negative statements about opponents to reduce the risk of alienating their supporters.
- A 2023 article assesses Alaska’s first use of a nonpartisan primary and RCV general election. The authors find that “the reform was both consequential and largely beneficial, promoting greater choice for voters, more accommodating campaigning, and generally more moderate outcomes than likely under the old rules.” See Alaska’s New Electoral System: Countering Polarization or “Crooked as Hell’? by Benjamin Reilly, David Lublin, and Glenn Wright.
- RCV resulted in a more positive congressional primary in Virginia, according to a survey of Virginia Republican primary voters who used RCV in 2022. (See Measuring The Effects Of Ranked Choice Voting In Republican Primaries from the Center for Campaign Innovation. 2022.)
- First-time RCV users in Santa Fe in 2018 reported more positive campaigning. 67% of poll respondents believed the tone of the mayoral election was more positive than prior mayoral elections while only 3% responded that the tone was more negative. (See Santa Fe Voters Support Ranked Choice Voting and Have High Confidence in City Elections by FairVote. 2018.)
- Voters in RCV cities were more satisfied with the conduct of campaigns and perceived less candidate criticism and negative campaigning compared to voters in non-RCV cities, according to a 2013 and 2014 survey. Virtually every demographic group studied reported less negativity in RCV cities. (See Socioeconomic and Demographic Perspectives on Ranked Choice Voting in the Bay Area by Sarah John and Caroline Tolbert. 2015. The survey methodology document for the Eagleton Poll is also available.)
- Media coverage in RCV cities was 85% more positive than negative, according to a 2013 analysis. By contrast, 77% of news coverage in non-RCV control cities was positive. (See Content Analysis of Campaign Tone in Newspapers and Twitter Feeds in 2013 RCV Elections, by FairVote. 2015.)
- A 2021 analysis found that candidates were more likely to engage with each other in RCV cities than in plurality cities. Articles about campaigns in RCV cities had far more positive than negative words. This effect was not present, however, on social media. (See Using Campaign Communications to Analyze Civility in Ranked Choice Voting Elections, by Martha Kropf. 2021).
- A 2016 study found that “people in cities with (RCV) were significantly more satisfied with the conduct of local campaigns than people in similar cities with plurality elections” and “less likely to view campaigns as negative, and less likely to respond that candidates were frequently criticizing each other.” (See Campaign civility under preferential and plurality voting, by Todd Donovan, Caroline Tolbert, and Kellen Gracey. 2016 and Experiments in Election Reform: Voter Perceptions of Campaigns Under Ranked Choice Voting vs. Plurality Voting, by Caroline Tolbert. March 2014).
- To learn more, read our series on research on civility in RCV:
- Ranked Choice Voting and Civility: New Evidence from American Cities by Andrew Douglas. (April 2014).
- Ranked Choice Voting in Practice: Candidate Civility in Bay Area Elections, November 2014 by Sarah John. (February 2015).
- Ranked Choice Voting in Practice: Content Analysis of Campaign Tone in Newspapers and Twitter Feeds in 2013 RCV Elections by Sarah John. (February 2015).
- Socioeconomic and Demographic Perspectives on Ranked Choice Voting in the Bay Area by Sarah John and Caroline Tolbert. (April 2015).
Research on proportional representation
Proportional representation awards legislative seats in proportion to the votes earned by candidates or parties. Many countries around the world use proportional representation for national elections and local elections, but it is relatively uncommon in the United States. The Fair Representation Act is a form of proportional representation.
Research shows that proportional representation is effective at delivering fair outcomes.
- Proportional RCV, also known as single transferable vote or STV (and also what the Fair Representation Act uses), tends to elect candidates of choice for people of color in proportion to their share of the population, according to a 2021 study. The authors note that proportional RCV will stably and reliably secure representation for people of color, whereas single-winner districts can have a wide range of performance and it is difficult to produce district maps that hold up over time with respect to voter turnout and residential shifts. These concerns are not present with proportional RCV, because proportionality is a structural property. (See Ranked Choice Voting and Minority Representation, by Gerdus Benade, Ruth Buck, Moon Duchin, Dara Gold, and Thomas Weighill, 2021).
- Proportional RCV for the U.S. House of Representatives would lead to fair representation for each political party, according to a 2021 study. Additionally, advantage-seeking partisans would have their power to gerrymander significantly curtailed. (See Combatting Gerrymandering with Social Choice: the Design of Multi-member Districts by Nikhil Garg, Wes Gurnee, David Rothschild, and David Shmoys, 2021.)
- Multi-member districts produce more diverse racial representation, according to a 2021 study of election methods around the world. (See Multi-seat Districts and Larger Assemblies Produce More Diverse Racial Representation by Michael Latner, Jack Santucci, and Matthew Shugart, 2021.)
- A 2022 report finds that The Fair Representation Act (multi-member Congressional districts with proportional RCV) would improve representation for communities of color in nearly every state. Even more strikingly, it finds that these positive impacts are essentially immune to gerrymandering – the positive findings remain regardless of how the lines are drawn. (See Modeling the Fair Representation Act and the complementary 50-state supplement by the MGGG Redistricting Lab, 2022.)
- Multiparty proportional or ranked-choice systems can offer the benefits of a small winner-loser gap and an absence of interparty animosity, according to a2021 study based on a large-scale behavioral game. The study finds that certain institutions, namely those based on proportional representation and RCV, as well as multiparty arrangements, decrease “perceived legitimacy gap”, meaning election winners and losers are in closer agreement that the election is legitimate. (See Electoral Systems and Political Attitudes: Experimental Evidence by Sean Fischer, Amber Lee, and Yphtach Lelkes, 2021.)
- A 2022 report on redistricting in the U.S. finds that there are limits to “fair” maps when using single-winner districts, and makes a strong case for proportional representation in multi-winner legislative districts. (See What We Know About Redistricting and Redistricting Reform from the New America Foundation, 2022.)
- International research examines vote transfer in areas with ethnic conflict and determines that proportional RCV (also known as single transferable vote) is appropriate for divided societies. (See The single transferable vote and ethnic conflict: The evidence from Northern Ireland.)
- Scottish voters make the most of their preferences when voting for local councils with proportional RCV. 86% of ballots ranked multiple preferences and 61% contained three or more – a steady growth since the first proportional RCV election in Scotland. (See The Power of Preferences: STV in Scottish Local Elections.)
- Globally, countries using proportional representation voting typically see higher turnout, even when controlling for factors such as GDP, level of democracy, and level of competition (see studies here , here, here, and here ). Most estimates put this turnout boost in national elections at 5 to 7 percentage points compared to majority and plurality elections, respectively. See also a study attributing Malta’s near-universal turnout to maximization of the impact of a single ballot through proportional RCV.
- Women are more likely to be elected in multi-member districts, with The number of candidates to be elected in each District. Single-Winner Districts elect one member of the legislature whereas Multi-Winner Districts elect two or more.District Magnitude (number of people elected per district) as a key predictor. This is true internationally and in U.S. state legislatures. (See District Magnitude’s Effect on Female Representation in U. S. State Legislatures by Richard Matland & Deborah Dwight Brown, 1992, and Electoral Systems, Contextual Factors and Women’s Opportunity for Election to Parliament in Twenty-Three Democracies by Wilma Rule, 1987.)
- Societies with proportional representation are less prone to gerrymandering, according to a 2016 paper. (See Gerrymandering in comparative perspective by Ferran MartÃnez i Coma and Ignacio Lago, 2016.)
- Proportional RCV produces similarly proportional representation to open or closed party list systems, especially in politically polarized contexts, according to analysis of representation of grouped voter preferences in Scottish elections and simulated elections. Notably, proportionality with RCV can reflect support across multiple overlapping differences among voters, such as party, race, or geography. (See Proportionality for ranked voting, in theory and practice by Gerdus Benadè, Christopher Donnay, Moon Duchin, and Thomas Weighill, 2025.)