Proportional ranked choice voting and neighborhood representation
Executive summary
- Proportional representation allows different groups of voters to elect winners in proportion to their share of the votes cast. Proportional ranked choice voting (RCV) is the only form of proportional representation used in the United States.
- Proportional RCV delivers both majority rule and minority voice. For example, if a community represents 25% of voters in a three-member district, they’ll be able to elect a candidate of their choice; in total, at least 75% of voters will elect a candidate of their choice. This maximizes the number of voters electing someone who represents their interests.
- Case studies from Portland, OR and Cambridge, MA show how this applies to neighborhood representation – voters from different neighborhoods are able to elect candidates of their choice, whether elections are at-large or district-based.
Introduction
Proportional representation systems allow different groups of voters to elect winners in proportion to their share of the votes cast. For instance, if 60% of votes go to conservatives and 40% go to liberals, then about 60% of seats go to conservatives and 40% go to liberals. Compared to single-winner elections, proportional representation systems facilitate broader representation in government along racial, ethnic, ideological, and economic lines.
Proportional ranked choice voting is the only form of proportional representation used in the United States. Proportional RCV allows voters to rank candidates in order of preference. It has been implemented to elect local governing bodies in seven American cities and counties.

This report explores how proportional RCV impacts neighborhood representation. In a city, different neighborhoods can have distinct interests, shaped by historical, economic, and cultural factors.
The winners of a multi-member, proportional RCV election are the candidates who cross the “victory threshold.” The threshold is based on the number of seats to be elected. For example, in a three-member district, the threshold to win a seat is 25% of the vote – meaning at least 75% of voters elect a candidate of their choice. In districts with more members, the threshold is lower.
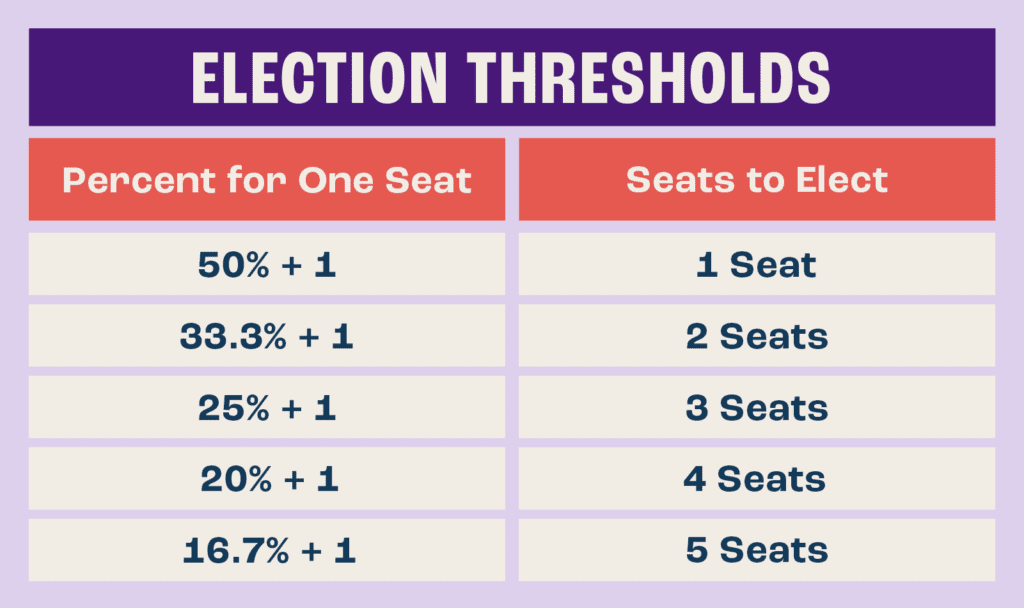
As a result, proportional RCV empowers non-majority groups that are shut out in single-winner elections. This includes neighborhoods within a city or district – for example, if a neighborhood’s population makes up 25% of voters in a three-member district and votes cohesively, they’ll be able to elect a representative of their choice.
We study two cities – Portland, Oregon and Cambridge, Massachusetts – that use proportional RCV to elect their city councils. Cambridge elects all nine councilors in one at-large district, while Portland’s 12-member City Council is elected from four districts with three members each. With or without districts, a supermajority of voters in both cities see at least one of their top three candidates elected to office.
Proportional RCV offers the opportunity for distinct neighborhoods to win representation, and this holds whether or not the city is drawn into districts. We find several examples of “neighborhood candidates” who earn most of their support from specific geographic areas. Other candidates win with districtwide appeal – appealing to voters with less localized interests. Officials elected with proportional RCV may represent a neighborhood with localized interests, or they may draw support from voters who are united on ideological or other non-geographic lines.
Portland, OR
Portland is the largest American city using proportional RCV, first implementing it in November 2024. In 2024, more than 80% of all Portland voters ranked at least one winning Council candidate in their top three choices. The city is divided into four, three-member Council districts; the maps below show which winner earned the most first-choice support in each precinct.
Figure 1: Winning candidate with the most first-choice support in each precinct, 2024
These maps provide an initial sense of how proportional RCV performed in terms of representing particular neighborhoods. We can see that some candidates win with mostly localized support, while others earn support from all across their district. In proportional RCV elections, both are viable paths to victory. We examine these dynamics in more detail for Districts 1 and 2.
Figure 2: Share of District 1 voters who ranked each winning candidate in their top three choices
These maps show the share of voters in each precinct who ranked each District 1 winner first, second, or third. The maps reveal that each winner had a different neighborhood as their core base of support:
- Candace Avalos performed well across the district, but had especially strong support in the southwest.
- Jamie Dunphy had strong support in the northern and northwestern precincts.
- Loretta Smith’s support was concentrated in the eastern precincts.
Previous research has found that Avalos’ support was higher in precincts with a higher Hispanic or Latino population, and Smith’s support was higher in precincts with a higher Black population. With proportional RCV, these communities won representation despite being minority voting groups, and being concentrated in particular neighborhoods.
Figure 3: Share of District 2 voters who ranked each candidate in their top three choices
District 2 has different dynamics than District 1. Instead of three winners with support from different neighborhoods, we see two candidates with similar maps of support, and a third whose map is almost the inverse. District 2’s Elana Pirtle-Guiney and Dan Ryan were most strongly supported in a few southeastern precincts and one western precinct. The neighborhoods where Sameer Kanal performed best are those where the other candidates performed worst.
Kanal was the first candidate to win a seat, followed by Pirtle-Guiney and Ryan in later rounds of counting. One likely reason for the similar maps and order of election is that Pirtle-Guiney and Ryan pulled support from a similar constituency that makes up around 50% of voters, while Kanal represents a minority voter group in the district.
With proportional RCV, Pirtle-Guiney and Ryan were not penalized for winning support from the same group of voters, and Kanal represented a group of voters that would likely have been unrepresented in a single-winner or plurality block election.
Cambridge, MA
Cambridge, MA has used proportional RCV to elect its City Council since 1941. The city elects all nine members at-large, rather than using districts. As in Portland, the vast majority of voters win representation – a median of 95% of voters see one of their top three candidates elected to office. And, even without districts or wards, proportional RCV still ensures particular neighborhoods are represented when their voters have distinct preferences.
The following maps depict which winning candidate garnered the most first-choice support in each precinct in Cambridge’s last four City Council elections.
Across all four elections, precincts varied widely in their preferred candidates – and voters in many different neighborhoods were able to see one of their preferred candidates elected.
Winning candidates also live in different neighborhoods across the city. Often, candidates win the most first-choice support in their home precinct – such as Marc McGovern in 2023 and E. Denise Simmons in 2021. While the south of Cambridge may appear to be overrepresented for candidate residency, it is the most populous part of the city – so it makes sense that more candidates live there.
Overall, proportional RCV leads to geographically diverse representation, without the need to divide the city into districts.
Figure 4: Winning candidate with the most first-choice support in each precinct, 2019-2025
Another way to examine geographic support for candidates is to look at the share of voters in each precinct who ranked a candidate first, second, or third. The maps below show that, for many Cambridge candidates, citywide appeal is a winning strategy.
Figure 5: Share of Cambridge voters who ranked each candidate in their top three choices, 2019-2025
Several winning candidates had disproportionate support in specific parts of the city. Burhan Azeem and Sumbul Siddiqui are the clearest examples. Azeem’s support was deep in one southern precinct from 2021 to 2025, while Siddiqui had the strongest support in one precinct in north-central Cambridge.
Other candidates had strong support in a few precincts in a region. For example, in his successful 2019 reelection bid, Timothy Toomey won precincts clumped together in the southeast of the city. And in 2023, Marc McGovern was reelected with support from several south-central precincts near where he lived.
The city’s western “peninsula” provides an example of how a neighborhood with distinct preferences is represented in proportional RCV elections. The neighborhood’s voters primarily supported Patricia Nolan and Dennis Carlone in 2019 and 2021. After Carlone’s retirement, these voters supported Nolan and Paul Toner. Toner resigned before the 2025 election, and those neighborhoods’ voters then supported Nolan and Catherine Zusy. Across these elections, we can see a region that is consistent in supporting Nolan and another candidate. Proportional RCV has ensured consistent representation for that region.
Cambridge provides an example of how proportional RCV gives voters greater flexibility. Voters in particular neighborhoods are able to vote for candidates who appeal to their local interests and – as we see with candidates like Burhan, Azeem, Nolan, Carlone, and Zusy – successfully win representation. In addition, voters can choose candidates who campaign on citywide issues. Voters are very likely to elect candidates of their choice either way.
Conclusion
This report shows how proportional RCV provides pathways for neighborhood representation when voters have localized interests. Whether or not cities draw districts, neighborhood candidates can seek to represent communities that together meet the victory threshold. Voters in particular neighborhoods can band together to win local representation, just as voters united on other issues or identities can win representation. This flexibility is a valuable feature of proportional RCV.
Proportional RCV also lets candidates campaign for office in different ways. Candidates may draw deep support from one set of neighborhoods in their district, and/or they may draw broad support from voters spread through a wider area. Winning candidates live across their districts or city, and voters across the city have their preferences represented on the Council.