How to display results for proportional RCV elections
As more and more jurisdictions adopt the multi-winner version of ranked choice voting known as proportional ranked choice voting, election administrators, media outlets, and other organizations may be looking for ways to display proportional RCV election results. As with “choose-one” elections, it is important to remind voters that any preliminary results are unofficial while waiting for every ballot to be counted and certified.
FairVote recommends the following best practices for displaying results in a clear way, illustrated in these examples.
Summary of results
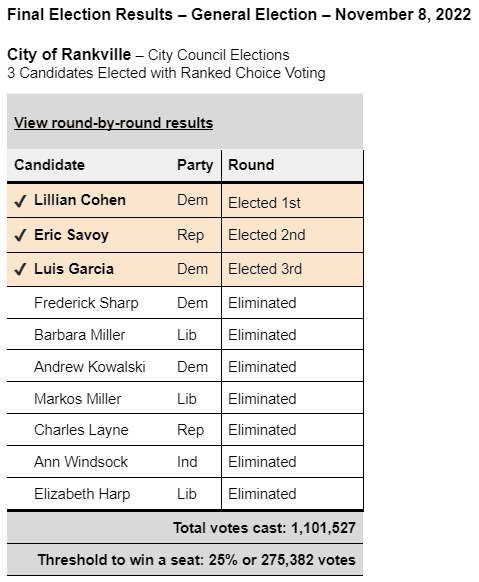
The most basic approach displays a static summary of results consistent with the recommendations on this page. Below is an example provided by the Center for Civic Design. This table clearly communicates the information most important to voters.
Detailed display options
Below are two options for displaying more detailed round-by-round results. Click on the detailed display options below to see more.
Detailed display #1: Bar chart series
The preferred way to display more detailed results is to use a series of bar charts. This helps viewers visualize how ballots are transferred between rounds.
Create a bar chart using RCVis.com or follow this style:
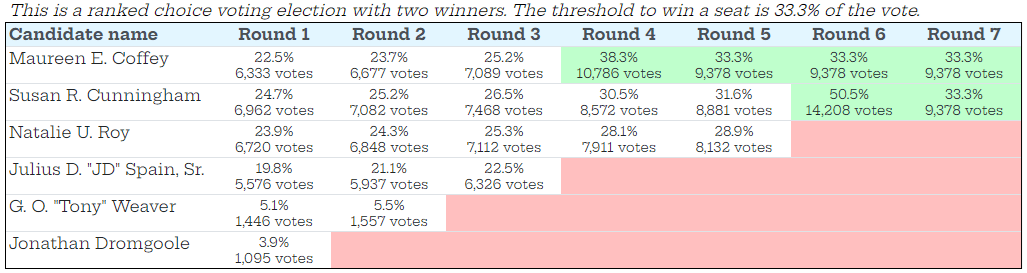
Detailed display #2: Round-by-round table
Another way to display more detailed results is to use a round-by-round table. Condensing all information into a single table is one of the most space-efficient ways to show RCV results.
Create a table using RCVis.com or follow this style:
Additional best practices for displaying results
- Emphasize the winning candidates. Clearly identify the candidates who won seats. That is the information of most interest to voters, with fewer voters interested in the details of the RCV tabulation.
- Focus on the final round. When displaying results, treat the final round as the most important data point, with earlier rounds as secondary information, space permitting. The key piece of information to convey is “who won the election,” not “who was ahead in first choices.”
- Keep visualizations simple. Tables or bar charts are typically the clearest way to convey this information. If space is limited, show only final results (as in the “City of Rankville” example above), with an option to “expand” or “view round-by-round results.” More complex visualizations (like Sankey diagrams) may help enhance some readers’ experiences, but should not be used in isolation.
- Include a written explanation that mentions it is a multi-winner RCV election. In addition to charts or tables, small written explanations can go a long way. Readers will need that information to understand why there are multiple winners and multiple rounds of counting. The display should also include the number of votes needed to win a seat so that voters understand why all winning candidates received the same number of votes. The detailed displays above from RCVis.com include short 1-2 sentence descriptors for each round – within the body of the chart.
- Be clear about the status of vote counting:
- If results are final, make that the primary information, showing first-round counts only in context or as part of a round-by-round display.
- If counting is still in progress or only first choices are available, make that abundantly clear and use cautious language when describing the state of the race. Include a “last updated” date and time that is refreshed with each new batch of data.
- Continue to emphasize the final round in all visualizations; if only first choices are available, leave the space for the final-round information blank. The candidates with the most first-choice preferences may be “ahead” at the start of counting, but they will not be elected unless they earn the number of votes needed to win a seat.
- If a preliminary RCV tally has been conducted but counting is still in progress, refer to candidates as “leading, 1st seat,” “leading, 2nd seat,” etc. Refer to candidates eliminated in the preliminary tally by their current order of finish (i.e. “currently 4th,” “currently 5th,” etc.)
- Order candidates by election and elimination. Display the candidates in order of election and elimination, with the first candidate elected at the top and the first candidate eliminated at the bottom. Once the results are finalized, the list should highlight the winning candidates and indicate the round in which each candidate was elected or eliminated. This is the clearest and best way to show voters each candidate’s level of support. As ballots are counted and preliminary results are reported, candidates may be displayed in the same order as they appear on the ballot (or in alphabetical order in states that rotate ballot order).
- Show only whole vote numbers when displaying results for a general audience. Fractions can be distracting to voters and are not particularly relevant to who won the contest, which is what voters truly care about. Fractions should only be included in the final, certified results.
- For election administrators only: Include a surplus transfer after the last winner is elected. In the round when the last winner(s) are elected, those winners may have surplus votes above the threshold. We recommend including a final round of surplus transfer to bring all winners in line with the threshold. This avoids the impression that the final winner(s) ended up with a larger vote share than prior winners and gives a full sense of the standing of the losing candidates. This is likely a setting within the tabulator, rather than a display setting.
Additional resources
RCVis is a free app for users to create visualizations of RCV election results. Users can upload their election results, choose from a variety of visualization options, and embed the visualizations on other websites (like FairVote did here).
The Center for Civic Design has researched and published best practices for results display and ballot design for RCV elections.
For election administrators, FairVote and the RCV Resource Center also offer a short report on the Best Practices for Releasing RCV Elections Results.