Ranked choice voting elections benefit candidates and voters of color: 2024 update
Explore the report content below, or download the full report as a PDF.
Executive summary
In this report, we examine how communities of color continue to experience positive outcomes from ranked choice voting elections. Previous research has shown that more people of color are elected in RCV contests; this report uses data from 448 RCV elections to understand why that is.
Our findings include:
- Candidates of color continue to benefit from the RCV counting process. When considering all candidates in single-winner RCV races who are active in at least two rounds of counting, White candidates increase their vote share between their first and final rounds by 12%. Candidates of other racial or ethnic backgrounds see larger increases – led by Black candidates with a 15% increase.
- Candidates of color pay no penalty when they run against other candidates of the same race or ethnicity. When a candidate of color is eliminated, ballots are more likely to transfer to other candidates of the same race or ethnicity. The median Black candidate earned 6% more votes than expected when other Black candidates were eliminated, suggesting a favorable transfer of support within their own community. The median Hispanic or Latino candidates earned 12% more transfer ballots than expected. The median Asian American or Pacific Islander candidate earned 33% more transfer ballots than expected, again indicating a positive in-group flow of support.
- Voters of color continue to demonstrate the tendency to rank more candidates than White voters. In a case study of the 2022 Oakland mayoral race, Black and Hispanic or Latino voters ranked more candidates than White voters on average. This builds on previous findings that voters of color rank candidates at high rates.
- Naturalized citizens and permanent residents support ranked choice voting and proportional representation. In May 2023, we launched a digital survey for this population, and over half of respondents identified as people of color. 81% said they would support using ranked choice voting in their area. The groups with the highest support for ranked choice voting were Black respondents and Hispanic or Latino respondents.
Introduction
Ranked choice voting (RCV) is a reform that seeks to make elections fairer for voters. Unlike most American elections, which only allow voters to select one candidate, RCV gives voters the option to rank candidates in order of preference: first, second, third, and so on. In the single-winner version of RCV, if a candidate receives more than half of voters’ first choices, that candidate wins, just like in any other election. However, if there is no majority winner after counting first choices, the race is decided by an “instant runoff.” The candidate with the fewest votes is eliminated, and voters who picked that candidate as “No. 1” will have their votes count for their next choice. This process continues until there is a majority winner – a candidate who earns more than half of the votes.
In the two years since the first version of this report was published, use of ranked choice voting has continued to grow across the nation.
As of December 2023, RCV is reaching 50 American jurisdictions that are home to over 13 million voters. That includes 2 states, 3 counties, and 45 cities. Military and overseas voters cast RCV ballots in federal runoff elections in 6 states.
Figure 1: Where RCV is used
Historic election outcomes using RCV
Ranked choice voting has contributed to many historic wins, with candidates of color and women gaining more representation in federal, state, and municipal offices. Below, we highlight several trailblazing outcomes that have occurred in the two years since the last edition of this report.
New York City
In 2021, New York City implemented ranked choice voting for its primary elections, and campaign season became more positive and collaborative. New York elected Eric Adams as its second Black mayor, and picked the most diverse city council in its history. For the first time, women won a majority of council seats.
Figure 2: Demographics of the New York City Council, 2009-2023
In a webinar hosted by RepresentWomen, women council members from New York City spoke about their campaign experiences. According to Council Member Nantasha Williams:
If I saw a lawn sign for someone else, I would go to the house and be like,
– NYC city councilmember Nantasha Williams
‘Hey! I agree with them on that. Will you rank me second?’ Something I
would’ve never done in a non-RCV election.
Rather than highlighting their opponents’ shortcomings, candidates made efforts to establish connections with voters who supported their opponents. Appealing to a wide variety of voters in ranked choice voting elections is important, because even if you can’t be a voter’s first choice, you can still be their second or third choice.
Additionally, with RCV, candidates from different backgrounds can run without needing to “wait their turn” in fear of taking votes away from a similar candidate, also known as “splitting the vote.” Ultimately, RCV contributed to a huge rise in representation for women and people of color in New York City.
Salt Lake City
In 2021, Salt Lake City used RCV to choose its city council members for the first time. People of color won a majority of seats, and most members identify as LGBTQ+.
This wave of newcomers came just two years after the city elected its first council member of color. Voters and elected officials alike were excited to see a shift in representation. As Council Member Darin Mano said:
Representation matters. Salt Lake City has always been inclusive, but it’s
– Salt Lake City councilmember Darin Mano
different to be around allies and to be represented by people who have
true, real, lived experience being a person from a diverse background.
Results from Salt Lake City’s 2023 RCV elections show that people of color will continue to hold the majority of seats on the city council.
Minneapolis and St. Paul
With each ranked choice election cycle, the diversity of the Minneapolis City Council has steadily increased, so that the current council represents and reflects the diverse array of communities, ethnicities, and backgrounds in the city.
In its 2013 RCV elections, Minneapolis elected its first Mexican American and Hmong American council members. In 2021, Minneapolis elected its first majority-people of color city council (eight out of 13 members). The first Somali American and first Latino members, elected to the council in previous years, won reelection. According to FairVote Minnesota’s By the Numbers factsheet, a woman and/or person of color won or ran a competitive campaign in 86% of offices up for election.
In Minneapolis’s 2023 RCV elections, the city elected a ninth council member of color.
St. Paul has also seen a notable rise in representation for people of color and women since ranked choice voting was implemented. In 2017, St. Paul elected its first Black mayor. In the 2023 elections, St. Paul elected an all-women city council; six of the seven members are people of color. Before RCV implementation, the council included only one person of color and one woman.
St. Paul Councilmember-elect Anika Bowie celebrated RCV in a joint 2023 press release issued by all seven councilmembers-elect:
We ran a race with a heart to serve everyone no matter their race,
– St. Paul councilmember Anika Bowie
gender, income, religion, or sexual orientation. This election brought
out historic turnout and a wide range of choices on the ballot, thanks to
ranked choice voting.
Figure 3: Growth in people of color on city councils since ranked choice voting implementation
Figure 4: Growth in women on city councils since ranked choice voting implementation
Candidates of color continue to benefit from the RCV counting process
FairVote’s 2021 report on RCV and communities of color demonstrated that candidates of color earn more votes in the RCV counting process than White candidates. Since the 2021 report, the total number of RCV races has grown by 50%, so we now reexamine that finding with more data.
In single-winner RCV elections, candidates of color tend to earn more votes via ballot transfer than White candidates, indicating that they are building strong coalitions and effectively campaigning across different voting blocs. (We use the term “ballot transfer” to describe when ballots are transferred from eliminated candidates to the remaining candidates in each round of vote tallying, reflecting the voters’ ranked preferences beyond their initial first-choice candidates.)
When considering all candidates in RCV contests who remain active in at least two rounds of counting, White candidates increase their vote share between their first and final rounds by 12%. Candidates of other racial or ethnic backgrounds see larger increases, led by Black candidates with a 15% increase.
Figure 5: Growth in candidate vote share between their first and final RCV rounds
When only considering candidates who won their races, the difference is even more stark. White candidates who won increased their vote share by 16% on average. Candidates from other backgrounds ranged between 20% and 28% on average, led by Mixed Race winners and Asian American or Pacific Islander winners.
Figure 6: Growth in winner vote share between their first and final RCV rounds
Candidates of color pay no penalty when running against candidates of the same race
To expand on the above analysis, we also consider whether candidates benefit from ballot transfer within their own racial or ethnic group. We studied all single-winner RCV elections from 2004 to September 2023 to test the hypothesis that when a candidate of color is eliminated in an RCV tabulation, ballot transfer benefits other candidates of the same race or ethnicity.
Our analysis includes every round of RCV tabulation in which a candidate of color was eliminated and the remaining active candidates included at least one same-race candidate and at least one candidate from a different race. In each case, we measure how many ballots were transferred to candidates of the same racial group and compare that to the expected transfer amount, or the number of ballots same-group candidates would receive if the ballots were divided evenly among the remaining candidates.
Figure 7: Ballot transfer to same-race candidates compared to expected value
The figure above shows how often candidates overperformed or underperformed expectations for ballot transfer when other candidates of the same race were eliminated. The dotted line at zero represents a candidate who performed as expected if there was no racial transfer benefit. All dots to the right of zero represent candidates who overperformed expectations when a same-race candidate was eliminated.
When Black candidates were eliminated, ballot transfer benefitted other Black candidates in 65% of cases. The median Black candidate earned 6% more transfer ballots than expected when other Black candidates were eliminated, suggesting a favorable transfer of support within their own community.
The median Hispanic or Latino candidate earned 12% more transfer ballots than expected, and 70% of Hispanic or Latino candidates overperformed expectations. The median Asian American or Pacific Islander candidate earned 33% more transfer ballots than expected, again indicating a positive in-group flow of support. 88% of Asian American or Pacific Islander candidates overperformed expectations.
White candidates also benefited from same-race ballot transfer, but not as much as other groups. The median White candidate overperformed expectations by 5.5% when a White candidate was eliminated, compared to 6.3%, 12.0%, and 33.1% for other groups.
These findings indicate that communities of color use RCV to build power when there are multiple candidates of the same race or ethnicity on the ballot, rather than dividing community support.
Case study: Voters of color continue to demonstrate the tendency to rank more candidates than White voters
The previous version of this report used case studies to show that voters of color tend to rank more candidates than White voters. We explore this finding with a more recent case study to confirm how voters of different racial and ethnic backgrounds engage with the ballot.
Because we do not know which voters cast which ballots, we used statistical analysis to draw conclusions about the behavior of different groups; specifically, we compared precinct demographics to the types of ballots cast in each precinct.
Ballot data was provided by election administrators in the form of “cast vote records” – a report of how each ballot was ranked, without the names or personal information of voters included. Demographic data is based on citizen voting age population (CVAP) data provided by the U.S. Census Bureau.
For this analysis, we used the 2022 Oakland mayoral race, in which voters had the option to rank as many of the five candidates running as they wanted.
The figure below shows each precinct in Oakland as one dot. The x-axis represents the population share of various communities in that precinct, and the y-axis represents the mean number of rankings used in that precinct.
As the percentage of Black and Hispanic or Latino residents in a precinct increases, so does the percentage of candidates ranked. This means that on average, Black and Hispanic or Latino voters ranked more candidates than White voters. Voters who are Asian American or Pacific Islander, on the other hand, ranked just marginally fewer (0.56%) candidates than White voters.
Figure 8: Percentage of candidates ranked by precinct demographics, Oakland 2022 mayoral race
In Oakland, Black and Hispanic or Latino voters were likely to rank more candidates on their ballots than White voters, reflecting their strong understanding of ranked choice voting and their willingness to actively participate in the RCV process. Such behavior plays a crucial role in enhancing representation in RCV elections.
As with the Oakland mayoral contest, in most cases we’ve examined, voters of color rank more candidates than White voters. However, findings from New York City’s 2023 RCV elections reveal additional insights on how ranking patterns vary, and how the context of each election can matter even more than voter demographics. Find FairVote’s analysis from New York City here.
Case study: Naturalized citizens and permanent residents support RCV and proportional representation
Naturalized citizens and permanent residents are historically underrepresented in political office. FairVote launched the New Citizens Project to understand attitudes toward election reforms among naturalized citizens and those on the path to citizenship. Our goal was to understand what may increase new citizens’ propensity to vote and their likelihood to support ranked choice voting and proportional representation.
Survey methodology
In May 2023, we surveyed naturalized citizens and permanent residents about these topics. To incentivize people to take the survey, and as a consideration of their time, we offered $10 each to the first 500 respondents.
The survey was available in six languages: English, Spanish, Korean, Haitian Creole, Mandarin Chinese, and Tagalog. With the help of permanent residents and naturalized citizens, we formed an Oversight Committee to help design, implement, and analyze the survey. Our primary target areas were New York City, Miami, and San Francisco, due to the high number of immigrants who live in these areas, as well as the high number of naturalizations that occur in them. However, the survey was digital, allowing people anywhere in the United States to complete It.
Survey outreach was performed on social media platforms such as Facebook, Instagram, and Twitter, both by FairVote and by members of the Oversight Committee. Additionally, targeted emails and text messages were sent to community leaders and organizations serving naturalized citizens and permanent residents.
Sample characteristics
Figure 9: Where our respondents are from
People from 43 states responded to our survey, with the most responses coming from California, Florida, Texas, and New York. Respondents came from 103 countries of origin, with the most common countries being Mexico, Spain, and China.
Respondents ranged from 18 to 80 years old. Just over half of the respondents were people of color or multiracial.
More men completed the survey than women. 75% of respondents reported having a college degree, whether that be an associate, bachelor’s, or higher.
Findings
Figure 10: Findings from survey questions
Ranked choice voting
71% of respondents said they understand ranked choice voting. After being asked to rank 2024 presidential candidates, 68% of respondents said ranking was easy. 81% said they would support using ranked choice voting in their area. The groups that indicated the most support for ranked choice voting were Black respondents and Hispanic or Latino respondents.
We asked respondents if they would be more likely to vote if they could use RCV in their area. 67% of Black respondents, 51% of White respondents, and 50% of respondents aged 65 or older said they would be more likely to vote, compared to 16%, 28%, and 25% from those groups who said they would be less likely to vote, respectively.
Proportional representation
72% of respondents would support proportional representation in their area. 42% of people who have voted in a country with proportional representation said it is more fair than winner-take-all elections, compared to 24% of people who have not voted in a country with proportional representation. Groups that are most supportive of proportional representation are Hispanic or Latino respondents, Asian or Asian American respondents, and respondents aged 50 and older.
Limitations
One limitation we faced was a small sample size of permanent residents compared to the sample size of naturalized citizens who took the survey. A more representative sample of permanent residents would have allowed us to complete a separate analysis of that population and their attitudes toward our reforms.
Looking to the future
We hope this data will encourage community leaders and elected officials to support ranked choice voting in cities and states with large populations of new citizens. Ranked choice voting can save money, increase participation from military and overseas voters, and increase representation for women and people of color. These new findings demonstrate that it is also attractive to new citizens and people on the path to citizenship – a growing bloc of voters in the U.S. – and even has the potential to increase turnout among this group.
Case study: Positive campaigning in New York City’s 9th District
Ranked choice voting leads to more positive campaigning, as candidates want to be the second choice of their opponents’ supporters. In some cases, like a Harlem city council primary in 2023, it even leads to cross-endorsements – where candidates express their support for each other, encouraging voters to rank them first and their opponent second.
This occurred in the 2023 Democratic primary to represent New York City’s 9th Council District, a 67% people of color district based in Manhattan’s historic Black hub of Harlem. Four Black candidates campaigned for the seat.
Candidates Yusef Salaam and Al Taylor endorsed each other and campaigned together, even though they were competitors.
Cross-endorsements help like-minded candidates stay in the race without fear of “splitting the vote.” Compare this to single-choice elections: Ideological allies often hurt each other because they split potential supporters. This can have a particularly harmful impact on candidates of color, if they assume much of their base of support is voters from their own community. A candidate may feel pressured to drop out to avoid splitting the vote.
In the RCV race, Salaam benefitted from ballot transfer when Taylor was eliminated, illustrating the positive effects of cross-endorsements.
Figure 11: Round-by-round tabulation of New York City’s 9th Council District primary
Case study: Alaska Native voters propel Mary Peltola to victory twice in 2022
Alaska voters elected the first Alaska Native to Congress in their first RCV election in 2022. Nearly 20% of Alaska voters are American Indian or Alaska Native, the highest share of any state. In both the 2022 special election and the 2022 general election, Alaska Natives’ votes were crucial to Peltola’s RCV victory.
In each State House district, we examine the share of Alaska Native voters and the vote share for Mary Peltola. An ecological regression shows that precincts with more Alaska Native voters had a higher share of first-choice support for Peltola. The relationship became even stronger in the November election than in the August special election.
Figure 12: First-choice support for Mary Peltola among Alaska Natives
An ecological inference suggests roughly 55% of Alaska Native voters ranked Peltola first in the August election, and 75% did so in November. Non-Native voters preferred other candidates in both elections.
Figure 13: Predicted vote share for Mary Peltola
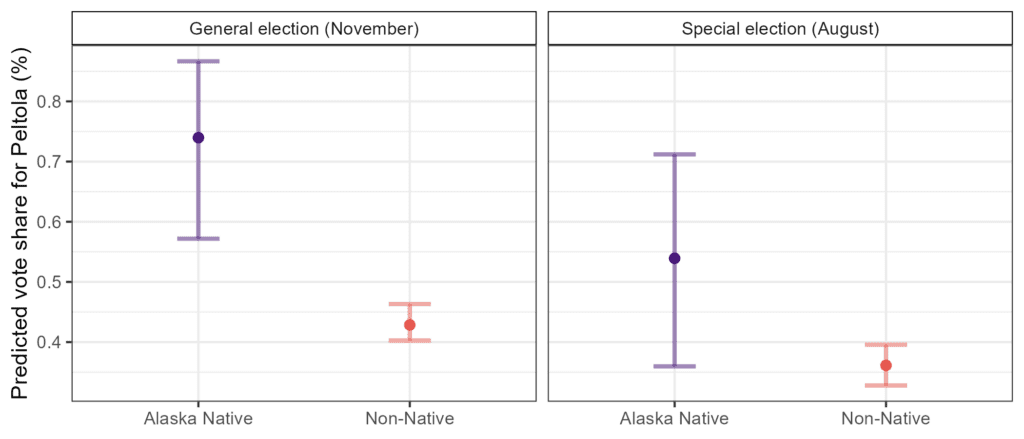
In the special election, 49% of voters ranked Peltola as their first- or second-choice candidate, while in the general election, 52% of voters ranked Peltola as their first or second choice. This increase suggests a positive shift in support for Peltola from both Native and non-Native voters.
Conclusion
In RCV elections, more candidates of color have been empowered to run for office, and more candidates of color are winning seats. Candidates and the communities they represent are building coalitions and coming together to work on the issues they care about. People on the path to citizenship are also embracing ranked choice voting.
RCV helps to level the playing field for candidates facing competitive elections. It empowers voters to make decisions based on their values and ideals, rather than make guesses about electability.
Further research is necessary to understand representation and engagement with ranked ballots among different racial groups, especially as ranked choice voting becomes more common in cities with diverse communities and evolves from being an innovative reform to an established practice.
Acknowledgements and additional resources
Special thanks to the members of the Oversight Committee (Stephanie Lopez, German Figueroa, Hans Huang, Esther Park, Raquel Baudrit, and Qin Huang) and our survey consultant (Chris Mansa LaPorte) for their work on the New Citizens Project.
The New Citizens Project was also informed by existing research from More Equitable Democracy, Democracy Rising, MinKwon, the New York Immigration Coalition, Community & Naturalization Organizer Dulce Gutierrez, Abraham Sanchez at ProgressNow New Mexico, and Comunidades Unidas.
Thank you to Cliff Albright, Executive Director of Black Voters Matter, for reviewing this report and providing feedback.
About the authors
This report was created by Sabrina Laverty and Deb Otis.
Sabrina Laverty is a Research Analyst at FairVote, where she researches city, state, and nationwide ranked choice voting efforts. Sabrina has a Master’s in Social Work from Columbia University, and she is also interested in community organizing, counseling, and working with immigrants and refugees.
Deb Otis is the Director of Policy and Research at FairVote. With a decade of experience in research and analytics, Deb is passionate about sharing the data-driven case for why our country needs election reform.