Proportional RCV gives voters more voice, and candidates of their choice
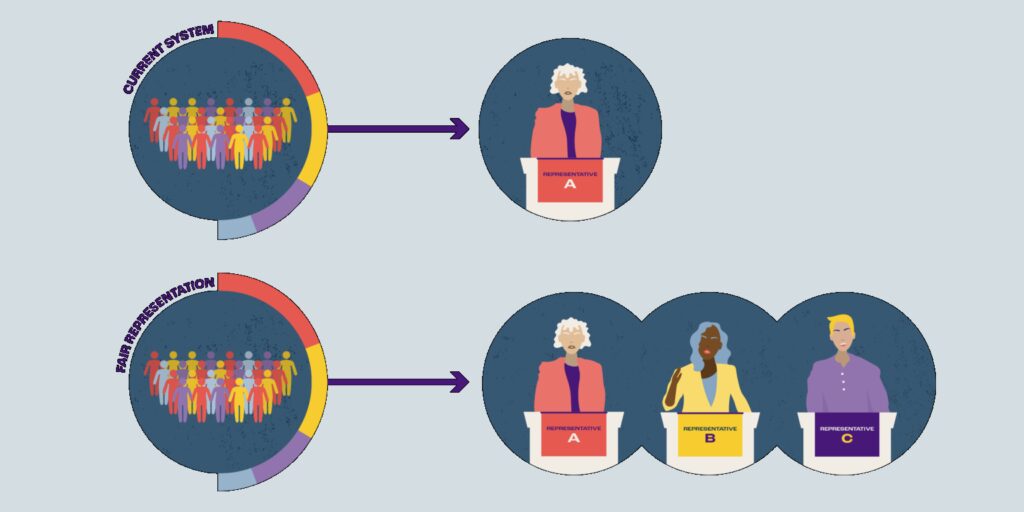
2022 was a landmark year for proportional ranked choice voting (RCV). Albany and Palm Desert, California used proportional RCV for the first time. Portland, Oregon voted to adopt proportional RCV for its city council elections, and Portland, Maine, voted to authorize their city council to switch from single-winner RCV to proportional RCV for some races.
Also known as the single transferable vote, proportional RCV is a voting system for multi-winner elections. The gold standard for legislative elections, proportional RCV allows voters to rank candidates in order of preference (in the same manner as single-winner ranked choice voting). Under proportional RCV, winners are elected in proportion to their level of support. (Read more about how it works here.)
Proportional RCV can maximize the benefits also seen in single-winner RCV, including more choices and better representation. It is tried and tested in several U.S. jurisdictions, so we know just how well it is working in practice. We analyzed ranking depth patterns in 27 proportional RCV races across Cambridge, MA, Minneapolis, MN, and Eastpointe, MI. Our findings are as follows:
Proportional RCV provides better choices
With more seats at stake and winners elected proportionally, it makes sense that proportional RCV would encourage more candidates to run. The data confirms this. As the graph below shows, the more seats awarded in the race, the more candidates tend to run. There are typically about two to three times as many candidates as there are seats. Most proportional RCV races invite five or more candidates. With proportional RCV, voters have ample choices on their ballots and therefore more power to hold legislators accountable.
Voters use the opportunity to rank
Do voters keep up with a greater number of candidates? The data says . . . yes! The more candidates there are on the ballot, and the more seats that are at stake, the more rankings voters tend to use. In the dataset, voters ranked a mean of four candidates. On average, 82% of voters ranked multiple candidates. Overall, voters in proportional RCV elections embrace the opportunity to express their preferences.
Most voters elect a candidate of their choice
In every single proportional RCV race analyzed, over 70% of ballots ranked a winning candidate in their top three. For most races, that number is over 90%. This means most voters elect a candidate of their choice. Under proportional RCV, nearly all voters are represented, and legislators have the true mandate of their constituents.
This analysis shows that proportional RCV delivers exceedingly on all that RCV has to offer – better choices, more voice, and better representation.
See the raw data here.