New Yorkers continue to embrace ranked choice voting: Analysis from the 2023 primary

New York City’s second election cycle with ranked choice voting (RCV) was a success, with elections held on June 27 and cast vote records released to the public in July. This post will explore our findings from analyzing the cast vote records. FairVote’s initial analysis of the results (before the additional data became available) can be found here.
New York City’s Board of Elections follows best practices by releasing cast vote records publicly. These anonymized files are digital records showing how each ballot ranked the candidates. Cast vote records provide additional transparency around RCV elections, including the opportunity for external validation and analysis of voter preferences that isn’t possible with most single-choice elections.
This election cycle was quieter than 2021’s due to a higher number of incumbents running for re-election in uncompetitive races. Across 24 contested primary elections for Democrats, Republicans, and Constitution Party voters, there were 14 contests with three or more candidates.
More candidates leads to more rankings
On average, 63% of voters ranked multiple choices, with more competitive races seeing more rankings. In races with only three candidates, 61% of voters ranked multiple choices, perhaps reflecting that voters were less likely to find multiple candidates on the ballot whom they wanted to support. In races with four candidates, 67% used at least two rankings, and voters in those contests ranked an average of 2.6 candidates out of 4.
Voters ranked more in more competitive contests.
| Mean rankings | % Ranked 2+ choices | |
| 2 candidate races | 1.4 | 36% |
| 3 candidate races | 2.1 | 61% |
| 4 candidate rankings | 2.6 | 67% |
This rate of ranking is comparable to New York’s 2021 RCV elections. Overall there was more ranking in 2021, likely a function of more high-profile contests like mayor and borough president. An apples-to-apples comparison – considering only city council races with 3+ candidates – shows that this year had a slightly higher rate of ranking (61%) than the 58% who ranked in similar races last cycle.
Voters of all demographic backgrounds use multiple rankings, but it can vary by council district
To better understand voter behavior, we examined how voters used their rankings by precinct, combined with demographic data on the voters in each precinct. This lets us see whether some voters tended to rank more candidates than others.
In the four districts with highly competitive RCV races (Districts 1, 9, 13, and 41), our findings varied. We conclude that ranking usage in New York depended more on the context of each election rather than any demographic factors.
In the District 13 Democratic primary, voters of color tended to use more rankings than White voters, with particularly strong ranking from Black voters.

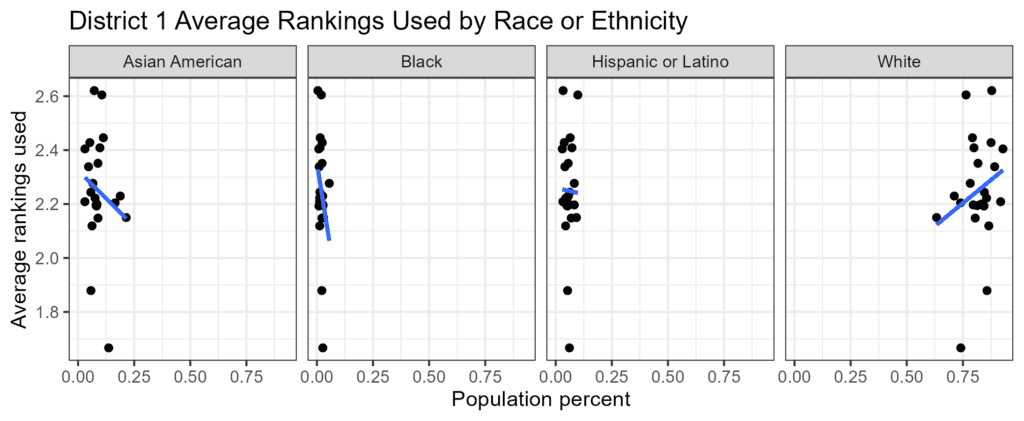
How to read this chart: Each dot is a precinct. The x-axis represents the portion of the population made up of each racial group. In the chart measuring Black voter behavior, the dots farther to the right are precincts with larger Black populations. The y-axis measures the average number of rankings used. Dots higher up are precincts where voters used lots of rankings.
In District 1, a Whiter district overall, White voters appear to have used more rankings, indicated by the upward-sloping line showing that precincts with more White voters used more rankings.
In Districts 9 and 41, flat or nearly-flat lines indicate no statistically significant relationship between race or ethnicity and the number of candidates ranked.
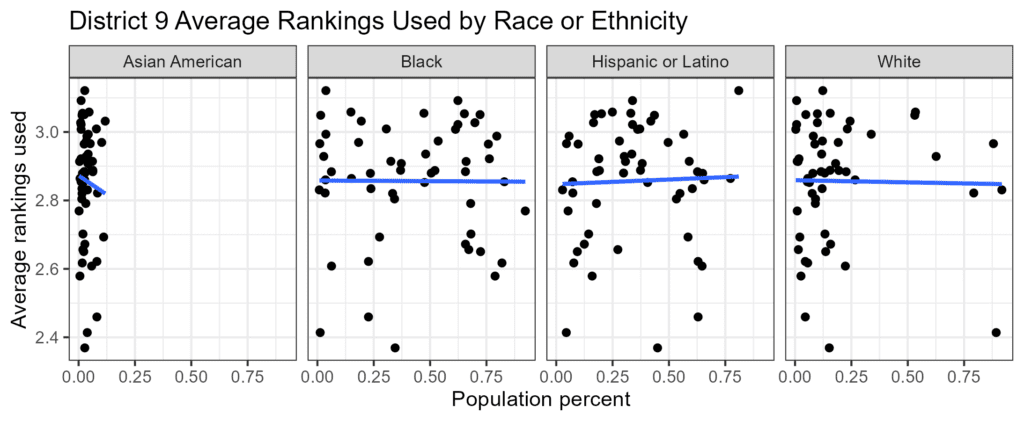
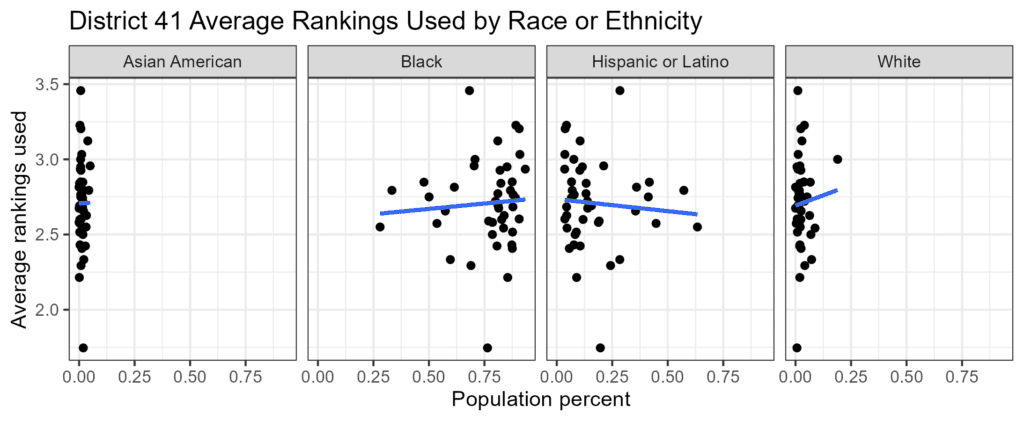
Because the demographics of who ranked the most candidates varied between districts, we conclude that ranking usage is not dependent on race or ethnicity overall. However, differences can arise within individual districts based on the context of each election.
Case study on voter behavior by party in District 13
District 13 had competitive primaries for the Democratic, Republican, and Constitution parties. Due to New York’s use of fusion voting in the general election, several parties can choose to nominate the same candidate. The three candidates running for the Republican nomination all also ran to be the Constitution Party nominee. We can compare these two races to glean additional insights about voter behavior.
Kristy Marmorato won both primaries, so she will appear on both the Republican and Constitution Party ballot lines in November. However, it took her multiple rounds to earn majority support from Republican voters, while Constitution voters delivered her an absolute majority of first choices (54%), negating the need to conduct the “instant runoff” round.
Additionally, voters behaved differently by party. 72% of Constitution Party voters chose to rank multiple candidates. Marmorato-Havranek was the most common pairing of first and second choices. In the Republican primary, 56% of Republicans ranked multiple choices. The most common ballot in that primary was Marmorato first with no other candidates ranked. Voters who choose not to rank multiple candidates in RCV races are typically indicating that they don’t like any of the other candidates, or that they have no preference between them.
Conclusion
Other locations can learn lessons from New York’s experience, including the benefits of releasing a full cast vote record to allow for fuller understanding of voter behavior. Ranked choice voting is the fastest-growing election reform in the nation, with two ballot measure wins on the books so far in 2023 and at least two states planning to vote on adopting RCV in 2024.